Grafana Variable Regex Broke My Query? 6 Traps I Tested
The most common reason to put a regex on a Grafana query variable is to make the
dropdown look nicer: web-01.example.com instead of web-01.example.com:9100. The
regex works, the dropdown looks right, and then every panel that uses the variable
says No data.
I ran Grafana 13.2.2 and Prometheus 3.14.0 in Docker and built one test
dashboard with 13 query variables and 10 Stat panels. Each panel counts the series
that match its query, so you can read off exactly what a variable expands to. The
data is six series of one metric, demo_up, created with Prometheus recording
rules. The instance labels are:
instance | job |
|---|---|
| 10.0.0.5:9100 | node |
| db-01.example.com:9100 | node |
| db-01.example.com:9187 | postgres |
| web-01.example.com:9100 | node |
| web-02.example.com:9100 | node |
| web-03.example.com:9100 | node |
Note that db-01 has two ports. That’s the host that exposes most of the traps.
Every variable uses the query label_values(demo_up, instance) with a different
regex.
Short answer (Grafana 13.2.2 + Prometheus 3.14.0, tested 2026-09-25):
| What you see | Likely cause | Fix |
|---|---|---|
| Panels show No data after you strip the port | The regex changes the value, not only the label. instance="db-01.example.com" matches nothing | Named groups: /(?<value>(?<text>[^:]+):\d+)/ shows the host and keeps the full value |
| You set Apply regex to: Display text, value is still cut | With label_values, text and value start out identical, and a capture group replaces both | Same fix, named groups |
| A host is missing from the dropdown | Your regex doesn’t match every value. Non-matching values are dropped without a message | Check Preview of values in the variable editor |
| Dropdown shows 2 options instead of 6 | Duplicate values after the regex are merged into one option | Put something unique in the value group |
| “Invalid group” on the variable | Variable regex is JavaScript. (?P<name>...) is Python/Go syntax | Use (?<name>...) |
=~"^(?!db-).*" works in the variable, fails in the query | PromQL uses RE2, which has no lookahead | Use !~"db-.*" in PromQL |
Where the variable regex is in Grafana 13
If you’re used to older versions: in 13.2.2, Dashboard settings → Variables only shows “Variable settings have moved to the dashboard’s sidebar” and a Take me there link. The Regex field is in the variable editor dialog: click the variable in the sidebar, then Open variable editor. The dialog has Preview of values at the top, which is the fastest way to check everything below.
Trap 1: stripping the port breaks instance="$var"
This is the question in a
Grafana forum thread
with 86,695 views (read 2026-09-25): label_values returns host:9100, and the poster
wants only the host name. One of the answers is /(.*):9100/. I used exactly that:
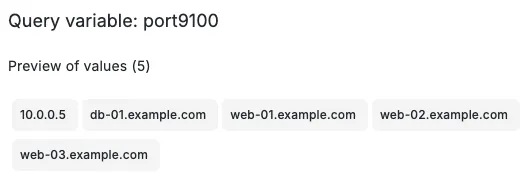
The dropdown looks right. Then I selected db-01.example.com and used the variable
in three queries:
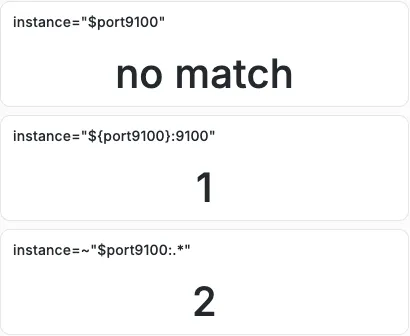
instance="$port9100"matched nothing. The variable’s value is nowdb-01.example.com, and no series has that exact instance label.instance="${port9100}:9100"matched 1 series. Adding the port back works, as long as every host uses the same port.instance=~"$port9100:.*"matched 2. It also picked updb-01.example.com:9187, the postgres exporter, which the regex had removed from the dropdown. That’s the usual “just add:.*” fix, and it brings back exactly what you tried to filter out.
The regex also did something the preview only shows if you count: there were 6
instances and the preview has 5. db-01.example.com:9187 doesn’t end in :9100, so
the regex didn’t match it, and it was dropped. No warning. With a general pattern,
/([^:]+):\d+/, all hosts stay, but db-01.example.com still appears only once
(more on that in Trap 3).
Trap 2: “Apply regex to: Display text” doesn’t keep the value
Grafana 13 has an Apply regex to setting with two options, Variable value
(the default, per the
variables docs,
read 2026-09-25) and Display text. It sounds like the fix for Trap 1: change only
what the dropdown shows. I tried it with /([^:]+):\d+/:
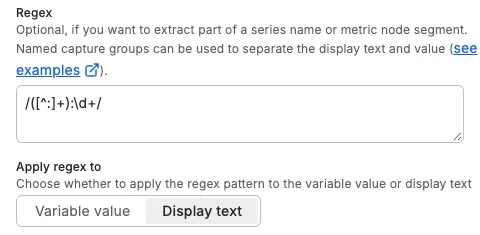
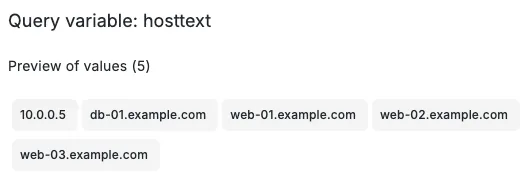
The panel with instance="$hosttext" still showed no match. The value was cut,
just like with Variable value.
The reason is in the code that applies the regex (metricNamesToVariableValues in
@grafana/scenes 8.13.5, the version Grafana 13.2.2 pins in its package.json).
“Apply regex to” only decides which string the regex runs against. When the regex has
a capture group, the result replaces both text and value:
// packages/scenes/src/variables/variants/query/utils.ts (@grafana/scenes v8.13.5)
const applyTo = variableRegexApplyTo === 'text' ? text : value;
// ...
} else if (firstMatch) {
  text = firstMatch[1];
  value = firstMatch[1];
}
label_values returns the same string as text and value, so both settings gave the
same result here. The option only makes a difference for data sources that return
separate text and value.
Trap 3: named groups, and why I got 2 options instead of 6
The way to keep the full value and show a short label is named capture groups. The
docs example
(read 2026-09-25) uses (?<text>...) and (?<value>...). My first attempt split the
instance into host (text) and port (value):
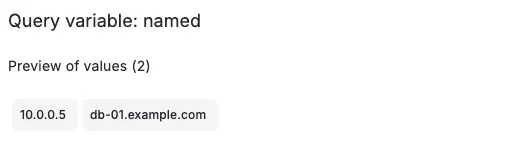
Six instances became two options. After the regex, the values were 9100 five
times and 9187 once. Grafana removes options with the same value
(uniqBy(options, 'value') in the same function) and keeps the first one. The first
9100 belonged to 10.0.0.5, so that became the label for all five.
What worked is a value group around the whole instance, with the text group inside it:
/(?<value>(?<text>[^:]+):\d+)/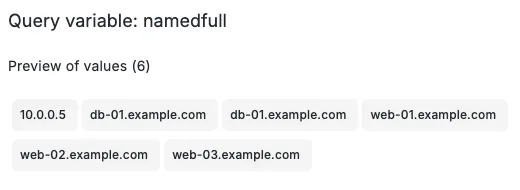
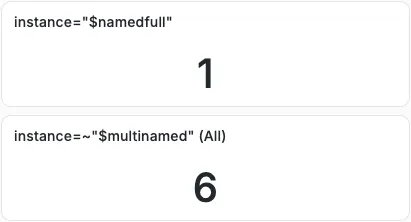
instance="$namedfull"with the firstdb-01.example.comselected matched 1, because the value is stilldb-01.example.com:9100.- The same regex on a multi-value variable with All matched all 6 series with
instance=~"$multinamed".
The catch is visible in the preview: db-01.example.com is listed twice, and the
dropdown doesn’t tell you which one is port 9100. If a host has several ports, keep
the port in the text, or filter the variable query to one job, for example
label_values(demo_up{job="node"}, instance). I didn’t test the job filter here.
Trap 4: forum regexes that drop characters
A popular answer in the same forum thread is /([a-zA-Z0-9\.]+)/: keep letters,
digits and dots. My host names have hyphens:
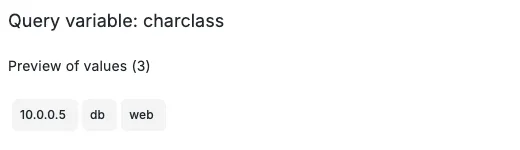
The capture stopped at the first -. db-01.example.com became db, all three web
servers became web, and the duplicates merged: 3 options from 6 instances. If you
copy a character class, check that it allows every character in your names, or use
“everything up to the colon”, [^:]+.
Trap 5: which regex flavor? Two different answers
A forum thread (38,761 views) asks exactly this, and the first answer says to test with the Golang flavor. Later replies disagree. In my test, both are right, for different fields:
The variable Regex field is JavaScript. Grafana compiles it with stringToJsRegex,
and the docs point to the Mozilla guide on regular expressions. Python/Go named-group
syntax fails:

The dropdown stayed empty (“No values found” in the editor preview). Flags work:
/WEB/i matched the three web- hosts. A negative lookahead also worked in the
variable. /^(?!db-).*/ left the 4 non-db instances.
The PromQL query is RE2 (Go). The Prometheus docs (read 2026-09-25) say “All regular expressions in Prometheus use RE2 syntax” and “Regex matches are always fully anchored”. I pasted the same lookahead into a panel query:
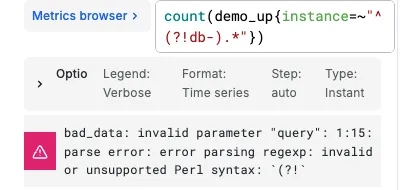
On the dashboard, the panel only shows a small red warning icon and whatever “no value” text you configured. The negative matcher does the same job and is valid PromQL:
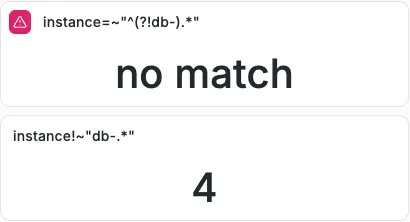
instance!~"db-.*" returned 4, the same hosts the variable lookahead kept. Because
PromQL anchors the whole string, instance=~"db-01.example.com" also matches nothing
when the label has a port. You need db-01.example.com:.*.
So: lookahead in the variable Regex field, !~ in the query. If you test on
regex101, use the ECMAScript flavor for the variable and Golang for PromQL.
Trap 6: :.* after a multi-value variable
With a multi-value variable that strips the port (/([^:]+):\d+/) and All
selected, instance=~"${multistrip}:.*" matched all 6 series. Grafana expanded the
variable to an escaped list, (10\.0\.0\.5|db-01\.example\.com|...), and the :.*
applied to the whole group. That works, with the same side effect as Trap 1: selecting
db-01.example.com alone matched 2 series, both ports (I checked this with the
single-value variable instance=~"$anyport:.*", which returned 2).
If you use a regex on a multi-value variable, the
PromQL list question
(39,146 views) has the other half: use =~"$var", not ="$var", so the list works.
What I’d do
- Strip the port only in the text, never in the value. Use
/(?<value>(?<text>[^:]+):\d+)/and keepinstance="$var"(or=~for multi-value). - Count the preview. If the number in Preview of values (n) is smaller than what the query returns without a regex, something was dropped or merged.
- Don’t rely on “Apply regex to: Display text” to protect the value with
label_values. In 13.2.2 it didn’t. - Write JavaScript regex in the variable, RE2 in PromQL. No
(?P<...>)in the variable, no lookahead in the query.
What this test does not cover
- Only Grafana OSS 13.2.2 and Prometheus 3.14.0 in Docker, tested 2026-09-25. The series come from recording rules, not real exporters.
- Only the Prometheus data source with
label_values. Data sources that return separate text and value (for example SQL with__textand__value) may behave differently with Apply regex to. I didn’t test them, or InfluxDB and Loki. - The global
gflag with several matches per value, and custom All values such as.*. - Grafana Cloud and older self-hosted versions. The variable editor may look different there, and I didn’t check which version added “Apply regex to”.