Grafana Join by Field Drops a Query? 4 Traps I Tested
Two queries, one table: that’s what the Join by field transformation is for. You pick a field, Grafana puts rows with the same value side by side. When it works, it takes ten seconds. When it doesn’t, it usually fails without any message, and you end up with a table that is missing a query, missing rows, or showing numbers that belong to a different row.
I ran Grafana 13.2.2 (the current release, published 2026-09-15) in Docker and built 13 table panels from the built-in TestData data source (CSV content), so I could see exactly which rows go in and which come out. Query A is a list of disks, query B is their status:
Query A:
device_id | model |
|---|---|
| d0 | Samsung 860 EVO |
| d1 | Kingston NV2 |
| d2 | WD Blue |
Query B:
name | status |
|---|---|
| d0 | OK |
| d1 | Error |
| d3 | OK |
Note that B calls its key column name, not device_id. That’s the first trap.
Short answer (Grafana 13.2.2, tested 2026-09-25):
| What you see | Likely cause | Fix |
|---|---|---|
| The joined table only has columns from one query | The key column has a different name in the other query. That query is dropped, with no warning | Rename the key first (Organize fields by name → rename), then Join by field |
| Rows that exist in only one query are gone | Mode is Inner | Use Outer (tabular) |
| A key that appears twice shows up only once | Mode is Outer (time series), the default | Use Outer (tabular) |
| Numbers repeated across rows, columns named “currency 1” and “currency 2” | You need two key columns, but Join by field takes one | Use Merge series/tables instead |
| The panel says “No data” after adding the join | No field selected, and your data has no time column | Pick the key in Field |
The three modes, and which one to pick
The Mode dropdown has three options. Their descriptions in the Grafana source (tag
v13.2.2, JoinByFieldTransformerEditor.tsx) are short, so here is what they did
with my data. For this test B’s key was also called device_id:
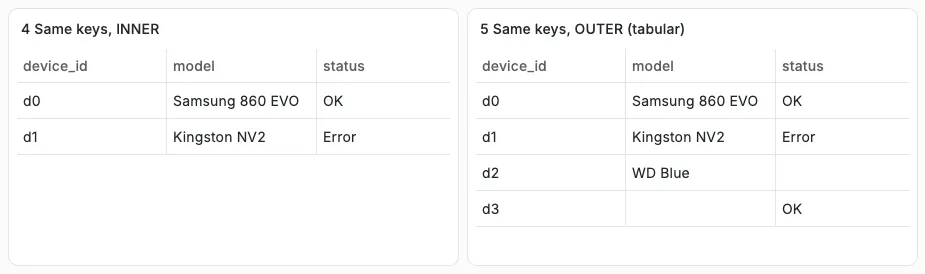
- Inner kept only d0 and d1, the keys that exist in both queries. d2 (no status) and d3 (no model) were dropped.
- Outer (tabular) kept all four keys, with empty cells where a query had nothing (right).
- Outer (time series) gave exactly the same four rows here (not pictured). With unique keys, the two outer modes behaved the same.
The Grafana docs
(read 2026-09-25) describe the two outer modes as “for Time Series data” and “for
SQL-like data”. The option descriptions in the source
(JoinByFieldTransformerEditor.tsx, tag v13.2.2) are more specific: Outer (time series) is “Join on
distinct field values”, Outer (tabular) is “Join on a field value with
duplicated values”. That difference matters, see Trap 2.
Outer (time series) is the default. If you add the transformation and only pick a field, that’s the mode you get.
Trap 1: the key column has a different name
This is the most common version of the question on the
Grafana forum (11,445 views
when I read it): two queries return the same values, but in columns with different
names. Join by field asks for one field name, so I picked device_id:
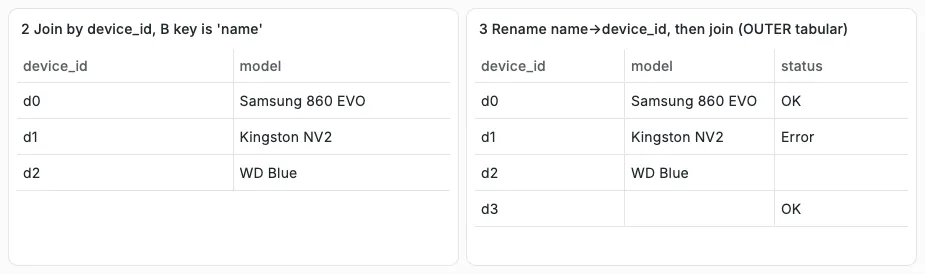
On the left, query B is simply gone. No status column, no d3 row. The editor doesn’t show a warning either:
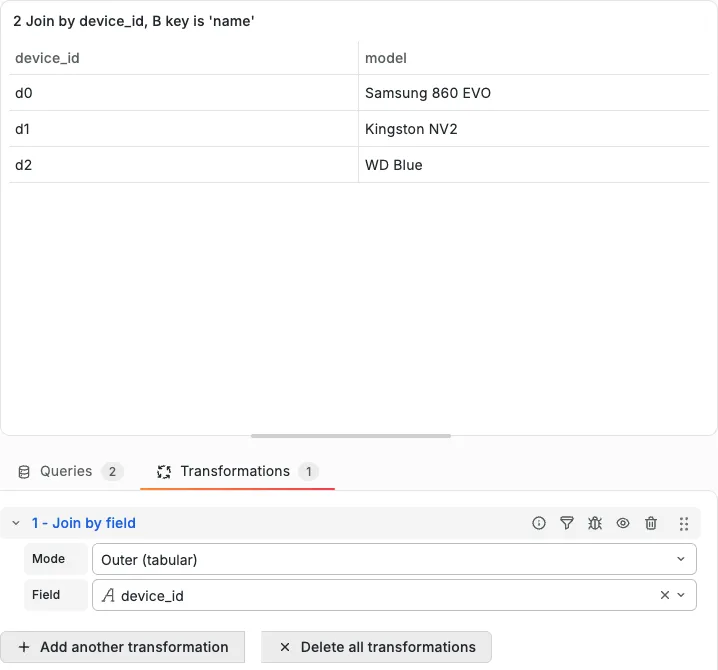
If you don’t look closely, this looks like a join that worked and found no matches.
Fix: rename the key in the second query before the join. I added Organize fields
by name as the first transformation and renamed name to device_id, then Join
by field on device_id. That produced the right table (right panel above).
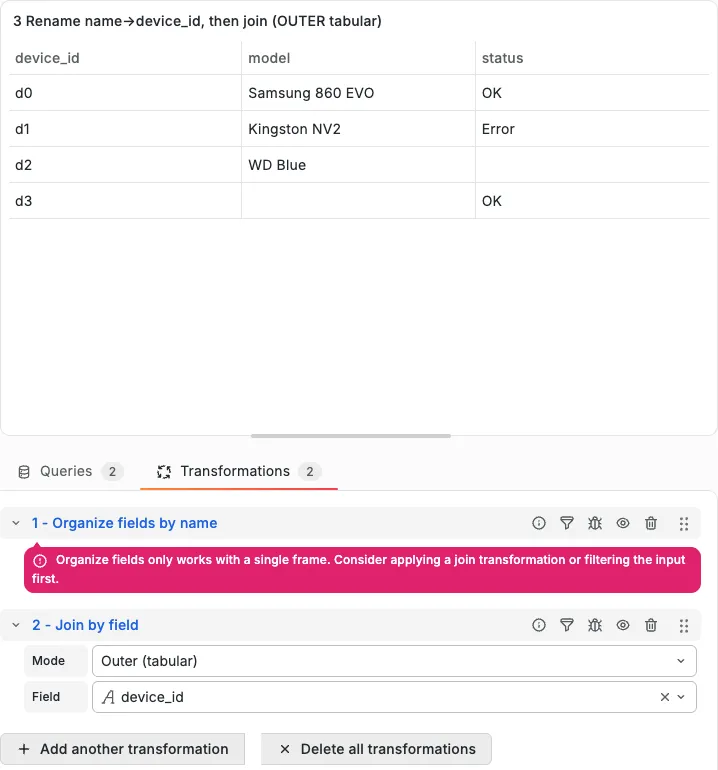
One thing that confused me: Grafana shows a red message on the Organize step, “Organize fields only works with a single frame”. The rename still worked in my test. The joined table has the status column and the d3 row, which it doesn’t have without the rename. I only tested renaming. I didn’t check whether reordering or hiding fields works in this position.
If your data source can rename in the query (for example label_replace in
Prometheus, which is what the forum poster did, or AS in SQL), that avoids the
extra step. I didn’t test those here.
Trap 2: duplicate keys and Outer (time series)
Now B has two rows for d0 (OK and Degraded), for example two status checks for the same disk:
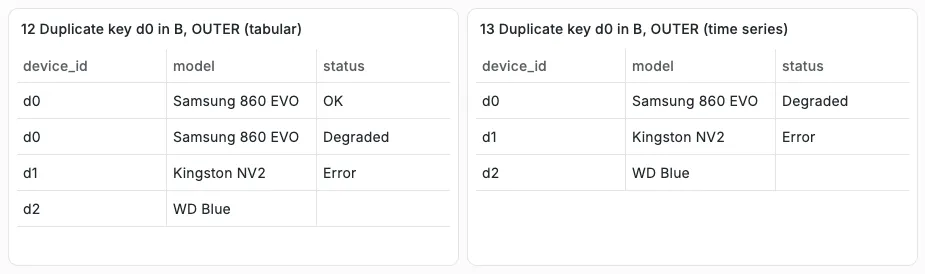
- Outer (tabular) kept both d0 rows (left).
- Inner also kept both d0 rows (not pictured: d0 OK, d0 Degraded, d1 Error).
- Outer (time series), the default, kept only one d0 row, Degraded, which is the later row in query B. The OK row was dropped, without a message.
That’s what “distinct field values” means in practice. The mode is built for time series, where each timestamp appears once. For tables with repeated keys, use Outer (tabular).
Trap 3: two key columns
A Stack Overflow question (12,234 views) and a forum thread ask the same thing: the rows are identified by two columns, not one. Join by field only takes one field. I tested orders and refunds, both keyed by channel and currency:
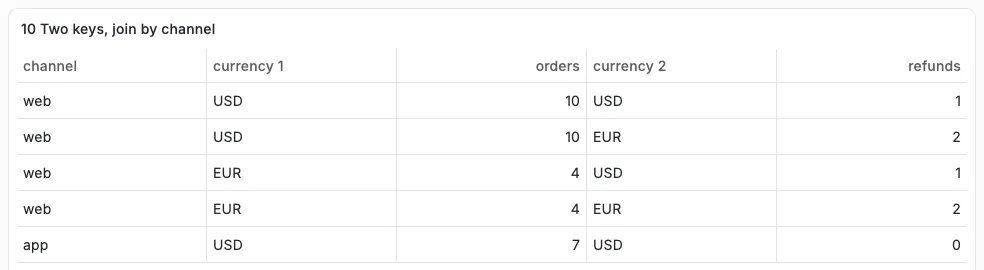
Joining on channel alone matched every web row in query A with every web row in query B. Two web rows in each query became four, plus one for app. The second key column appears twice, as “currency 1” and “currency 2”, and web USD is shown with a refund count of 2 that belongs to web EUR. Nothing in the table tells you it’s wrong unless you compare the two currency columns.
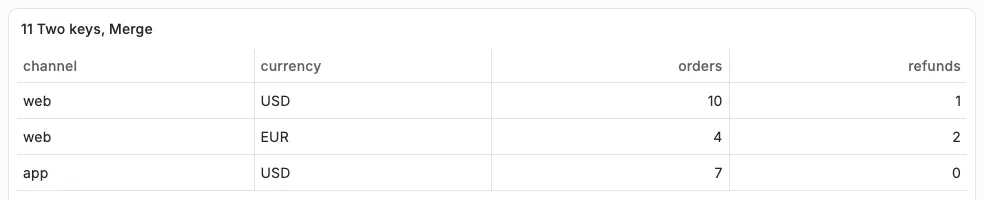
Fix: use Merge series/tables instead of Join by field. That’s also the accepted answer on Stack Overflow. Merge matched rows where all shared columns (here channel and currency) had the same values, and gave the three correct rows. There’s nothing to configure.
I didn’t test Merge with queries that share a text column that isn’t a key, for example a description that differs between the two queries.
Joining three queries
You don’t need one join per query. A single Join by field on device_id, Outer
(tabular), combined three queries into one table:
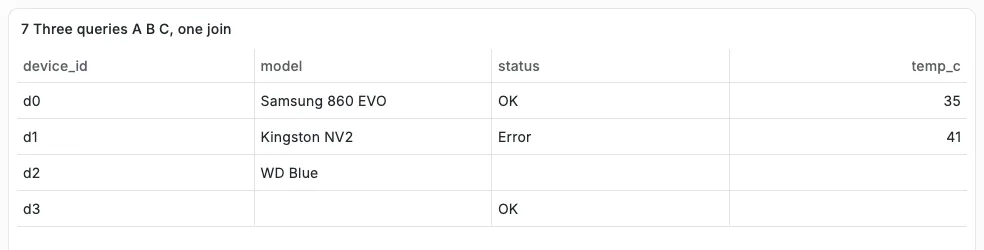
Every query needs the key under the same name, see Trap 1. A GitHub issue titled “No way to join the results from 3 queries into single Dataframe” is closed. I only tested this with CSV data from TestData.
Trap 4: “No data” after adding the join
When I added Join by field and didn’t select a field, the panel showed No data.
In the v13.2.2 source (joinByField.ts), the default options are no field and the
Outer (time series) mode. The docs say the join then uses “the first time column”.
My test data had no time column, so there was nothing to join on. Pick your key in Field and it works.
What I’d do
- Check that the key column has the same name in every query before you add the join. If one query seems to vanish, that’s the first thing to look at.
- Use Outer (tabular) for table data, not the default Outer (time series). It keeps unmatched rows and doesn’t drop repeated keys.
- If rows are identified by more than one column, use Merge, not Join by field.
- After any join, count the rows and compare them with the raw queries (Table view in the panel editor). None of the problems above shows a warning.
What this test does not cover
- Only Grafana OSS 13.2.2 in Docker, tested 2026-09-25, with the TestData data source (CSV content). I didn’t test Prometheus, SQL or the Infinity plugin, so I can’t say how their field names and types behave in a join.
- Time series data joined on the time column, and joins where the key has different types (number in one query, text in the other).
- Grafana Cloud and older self-hosted versions.