Grafana Value Mapping Not Working? 9 Rules I Tested
A value mapping in Grafana turns a number or a string into text and a color: 1 →
UP in green, 0 → DOWN in red. When it doesn’t work, Grafana shows no error.
The panel just shows the raw value, the wrong text, or the right text in the wrong
color.
I built a test dashboard with 33 Stat and Table panels on Grafana 13.2.3 (the current release when I tested, 2026-09-30). Each panel reads a small CSV from the built-in TestData data source and changes one mapping setting. The screenshots show the panel title, which names the setting, and what the panel displayed.
Short answer (Grafana 13.2.3, tested 2026-09-30):
| What you see | Cause | Fix |
|---|---|---|
| Two mappings match, the wrong one wins | Mappings are checked top to bottom; the first match wins | Drag the mapping you want to the top |
| A range boundary lands in the wrong range | Both ends of a range are inclusive | Make ranges not touch, e.g. 0–9.99 and 10–20 |
| Regex mapping never matches | Without /…/, the pattern must match the whole value | Match the whole value, or write /pattern/ |
| Regex mapping ignored on numbers | Regex mappings only look at strings | Use a Value or Range mapping |
| Mapping color not shown | Color mode is None, or a Table cell type is Auto | Stat: Color mode Value or Background. Table: cell type Color text or Color background |
| Text is right, color is the threshold color | The mapping has no color of its own | Set a color on the mapping |
| Null mapping never fires | Calculation is Last *, which skips nulls | Use Last if you want to see the null |
${var} shows up literally | Dashboard variables aren’t replaced in mappings | Not possible with value mappings |
Value 1 not mapped | The mapping key is 1.0 | Type the value exactly as Grafana shows it |
1. The first matching mapping wins
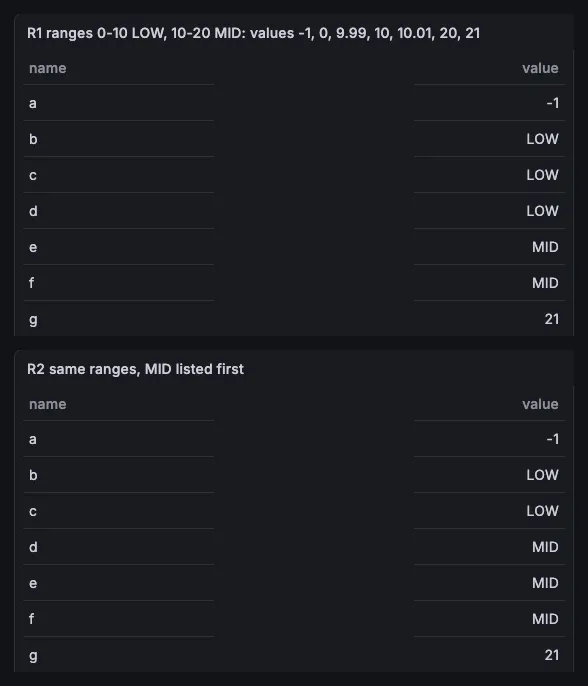
Two range mappings, 0 to 10 → LOW and 10 to 20 → MID, and the values −1, 0, 9.99, 10, 10.01, 20 and 21 (rows a to g):
- Both ends are inclusive. 0 became LOW, 20 became MID.
- 10 is in both ranges, so the order decides. With LOW listed first, 10 was LOW (top). With MID first, 10 was MID (bottom).
- Values outside every range (−1 and 21) are shown as they are.
The same rule applies across mapping types. A Value mapping does not win over a Range mapping just because it’s more specific:
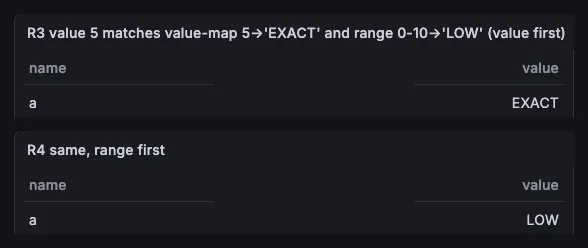
The value 5 matched both 5 → EXACT and 0–10 → LOW. Whichever was listed first
won.
A range with only From set (From 10, To empty) worked as “10 or more”: 5 stayed
5, while 10 and 1000 both became >=10.
The docs (Configure value mappings,
read 2026-09-30) don’t mention the order or the inclusive ends. The source does. In
Grafana v13.2.3, getValueMappingResult() in
packages/grafana-data/src/utils/valueMappings.ts loops over the mappings in order,
returns the first result it finds, and skips a range only when the value is
< from or > to.
Fix: reorder the mappings in the editor so the one you want is on top, or make ranges not touch (0–9.99 and 10–20).
2. Regex mappings: whole string, strings only
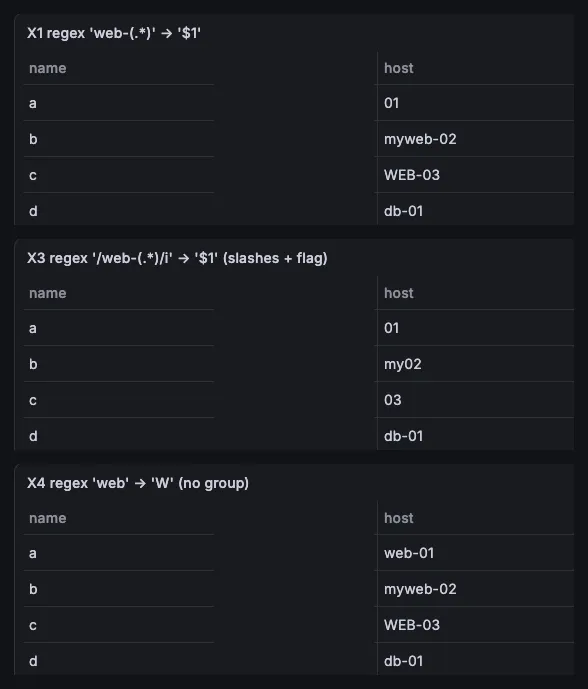
The data: web-01, myweb-02, WEB-03, db-01.
| Pattern → text | Result |
|---|---|
web-(.*) → $1 | 01, myweb-02, WEB-03, db-01 |
^web-(.*)$ → Web $1 | Web 01, myweb-02, WEB-03, db-01 |
/web-(.*)/i → $1 | 01, my02, 03, db-01 |
web → W | nothing changed |
- Without slashes, the pattern has to match the whole value.
web-(.*)gave the same matches as^web-(.*)$. It didn’t matchmyweb-02, andwebalone matched nothing at all. - With slashes, it’s a normal JavaScript regex.
/web-(.*)/imatched part ofmyweb-02and replaced only that part, givingmy02. Theiflag madeWEB-03match too.
The value mappings docs don’t state the whole-value rule. In the source, the regex
mapping calls stringToJsRegex() (packages/grafana-data/src/text/string.ts),
which wraps a pattern without slashes as ^pattern$.
Regex mappings ignore numbers. On a number column with 1, 10 and 21, the mapping
1(.*) → one$1 changed nothing, not even 1 and 10, which match that pattern as
a whole. The source skips any value that isn’t a string. For numbers, use a Value or
Range mapping.
3. Colors: when the mapping color shows up
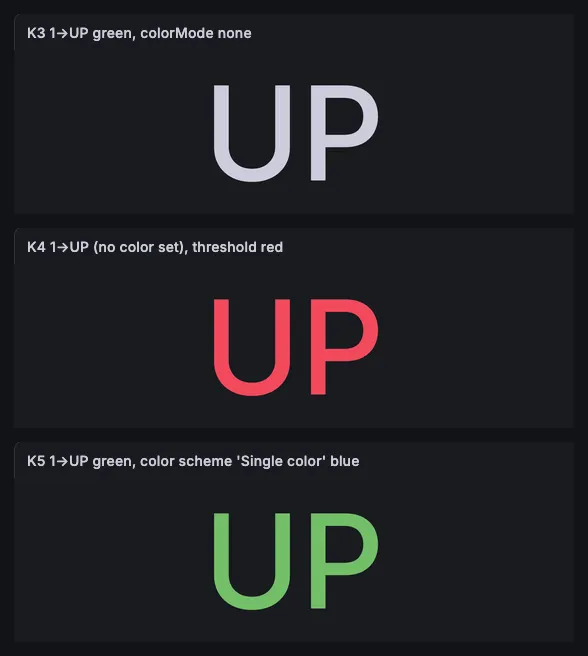
On a Stat panel, the mapping text UP had a green color set:
- Color mode Value: green text. Background: green background, white text.
- Color mode None: gray-white text. The mapping color is ignored (top).
- The mapping has no color: the text took the threshold color, red in my test (middle). A mapping without a color doesn’t mean “no color”.
- Color scheme Single color (blue): the mapping’s green still won (bottom).
In a table, colors depend on the cell type:
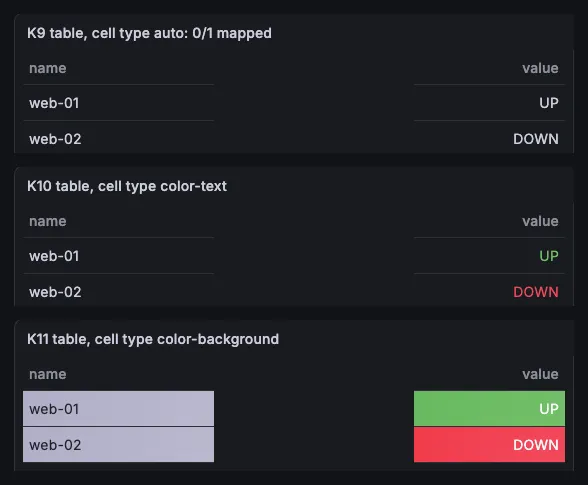
With the cell type on Auto, the text was mapped but had no color. Color text and Color background showed the mapping colors. The docs say this too, in their table example.
4. Null, NaN and “No value”
This is where the calculation matters more than the mapping.
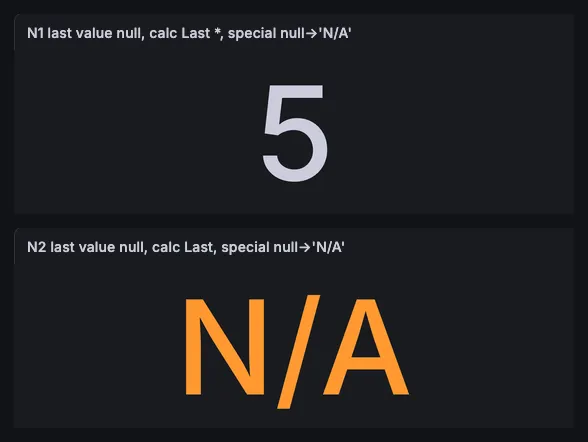
The data had two rows: 5, then an empty value. With a Special → Null mapping to N/A:
- Calculation Last * (last non-null) showed 5. It skips the null, so the null mapping never gets a null to map (top).
- Calculation Last showed N/A in orange (bottom).
More results from the same kind of panels:
| Data | Settings | Shown |
|---|---|---|
| Every value empty | Last *, Null → N/A | N/A |
| Every value empty | Last *, No value nothing, Null → N/A | N/A: the null mapping won over No value |
| CSV header only, no rows | Null → N/A | N/A |
| CSV header only, no rows | No value nothing, no mapping | nothing |
| Last value NaN | Last, NaN → not a number | not a number |
| Last value empty | Last, Null + NaN → N/A, no color | N/A in the default text color |
So if you set both No value and a Null mapping, you’ll see the mapping’s text. Pick one.
Empty (empty string) mappings: not tested in this batch. TestData reads an empty
CSV cell as null, not as an empty string. In my table test, empty cells showed the Null
mapping’s text, and a table with only an Empty mapping left the cell blank. That tells
you about TestData, not about the Empty mapping. To test Empty you need a data source
that really returns "".
5. Dashboard variables are not replaced
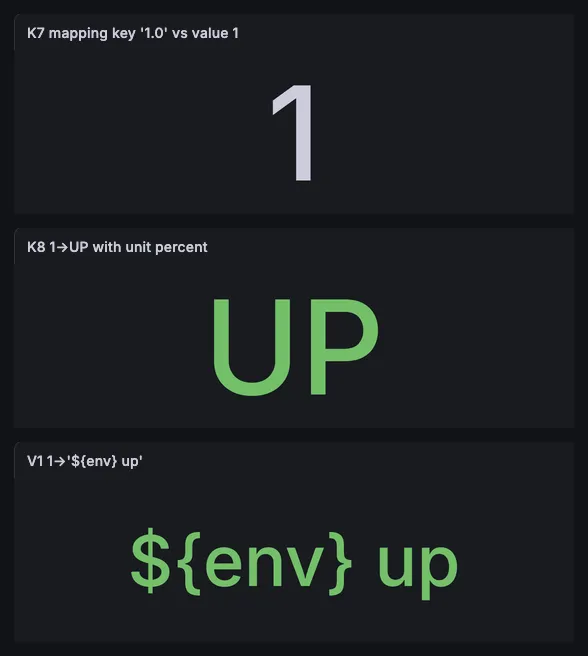
The dashboard had a variable env set to prod. A mapping 1 → ${env} up showed
${env} up, literally (bottom). A mapping whose key was ${one}, with the variable
one set to 1, didn’t match the value 1 at all.
Value mappings didn’t replace dashboard variables, in the text or in the key.
6. Two smaller ones
1.0is not1. A Value mapping with the key1.0didn’t match the value 1 (top of the screenshot above). The key is compared as text.0as a key worked fine for the value 0.- Mapped text has no unit. With the unit set to Percent, the mapped value showed UP, not UP %. The docs say this: value mappings “bypass unit formatting”.
What I’d do
- Put the most specific mapping first, and don’t let ranges share a boundary.
- Write regex patterns for the whole value, like
web-.*, or use/…/when you want to match part of it. - Give every mapping a color, or you get the threshold color.
- Decide between Last and Last * before you add a Null mapping. With Last *, the Null mapping only fires when there are no non-null values at all.
What this test does not cover
- Only Grafana OSS 13.2.3 in Docker, tested 2026-09-30, with the TestData data source (CSV content). I built the panels from dashboard JSON through the Grafana HTTP API and checked the rendered panels.
- Not tested in this batch: Empty (empty string) mappings, see above.
- Stat and Table panels only. Time series, bar gauge, state timeline and canvas can treat mapping colors differently; the docs say time series doesn’t use them.
- Boolean (true/false) special mappings.
- Grafana Cloud and older self-hosted versions.