Grafana Shows the Mean, Not the Last Value? 3 Causes I Tested
The standard answer to “how do I show the last value in Grafana” is one line: set Calculation to Last instead of Mean. That answer is from the Grafana 7 days, and on a current install it misses most of the cases that actually make a panel show the wrong number.
I ran Grafana 13.2.2 (the current release, published 2026-09-15) in Docker and fed every panel the same five points from the built-in TestData data source, one every 5 minutes:
| Time (UTC) | Value |
|---|---|
| 10:00 | 10 |
| 10:05 | 50 |
| 10:10 | 20 |
| 10:15 | 40 |
| 10:20 | (empty) |
The right answer for “latest value” is 40. The mean is 30, the max is 50, and the last row is empty. That makes it easy to see which calculation a panel really uses.
Short answer (Grafana 13.2.2, tested 2026-09-25):
| What you see | Likely cause | Fix |
|---|---|---|
| Stat or Gauge shows the average | The panel was migrated from an old singlestat panel, which becomes Calculation = Mean | Value options → Calculation → Last * |
| Panel is blank, legend cell is empty, table says NaN | You picked Last, and the newest point is empty | Use Last * (last non-null) instead |
| “Last” shows an older value, while the graph looks right | The rows aren’t sorted by time. Last means last row, not latest timestamp | Sort in the query, or add a Sort by transformation on the time field |
| Table shows every row, you want one value per series | A table doesn’t reduce anything by default | Transform → Reduce, Mode Series to rows, Calculations Last * |
New panels already use the last value
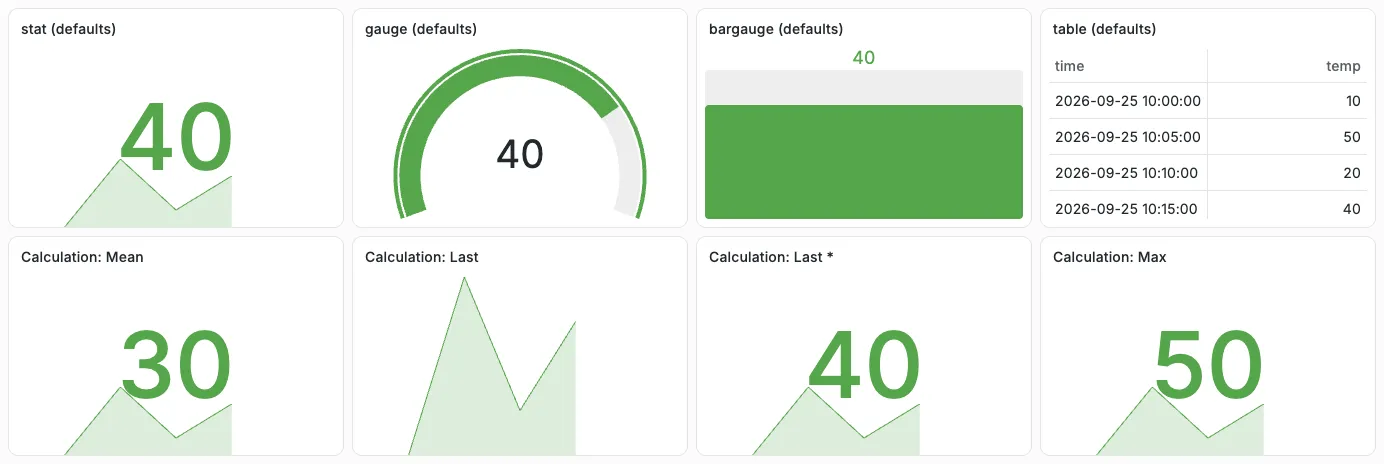
A new Stat, Gauge or Bar gauge panel that I created with no options at all showed 40 (top row). That’s Last *, not Mean. So on 13.2.2 you don’t have to do anything to get the latest value, if the panel is new.
The bottom row shows the same data with the calculation set explicitly. Mean gives 30, Max gives 50, Last * gives 40, and Last gives nothing. More on that below.
Cause 1: the panel came from an old singlestat panel
If your dashboard is old, or you imported it from an old export, it may still contain singlestat panels. Grafana 13.2.2 turned each one into a Stat panel when the dashboard loaded, without any message.
I imported panels in the old singlestat format. The result depends on the old
valueName setting:
| Old singlestat setting | Stat panel after migration | Shown |
|---|---|---|
"valueName": "avg" | Mean | 30 |
"valueName": "current" | Last * | 40 |
"valueName": "max" | Max | 50 |
no valueName at all | Mean | 30 |
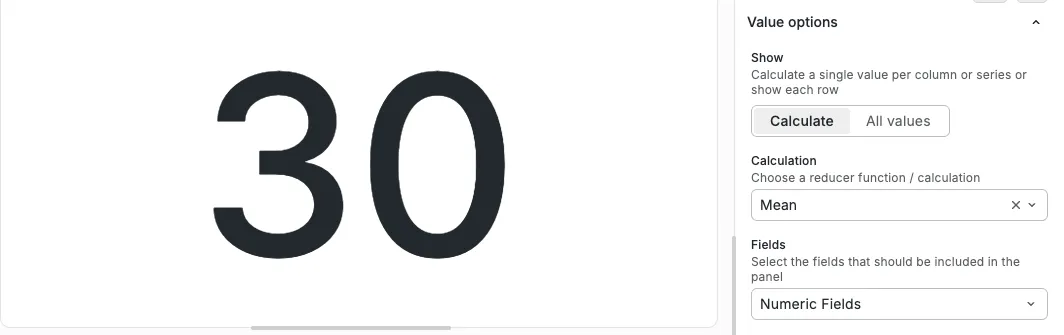
The last row is the one that catches people. If the old panel never set a value explicitly, the migration code falls back to Mean. This is the line, in the Grafana source at tag v13.2.2:
// packages/grafana-ui/src/components/SingleStatShared/SingleStatBaseOptions.ts
calcs: [reducer ? reducer.id : ReducerID.mean],
Fix: open the panel, go to Value options → Calculation, and change Mean to Last *. Save the dashboard so the change is written to the new panel type.
Cause 2: Last and Last * are not the same
The Grafana docs list both (calculation types, read 2026-09-25): Last is the “last value in a field”, Last * is the “last, not null value in a field (also excludes NaNs)”.
With my data, the last row is empty. What that looks like depends on the panel, and none of them shows an error:
- Stat panel with Last: only the sparkline, no number (screenshot above).
- Time series legend: the Last column is empty, while Last * shows 40.
- Table with a Reduce transformation: Last shows NaN.
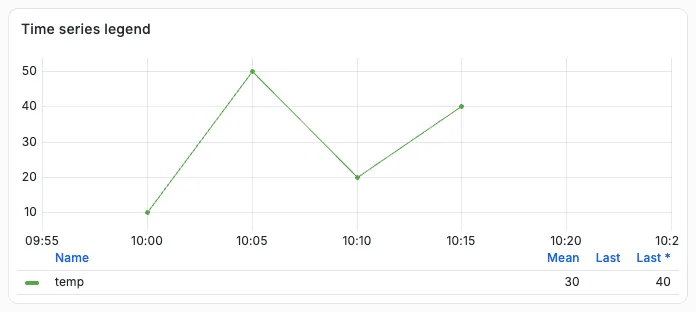
An empty last point is common in real data. The current time bucket may not be filled yet, or the last scrape may have failed. Use Last * unless you specifically want an empty panel to signal “no data right now”.
Cause 3: “Last” means last row, not latest time
This is the one from a Grafana forum thread: the legend showed an older value than the newest point on the graph, and the fix was sorting the query result by time.
I reproduced it with the same four points in a different order, with the 10:05 row (value 50) last:
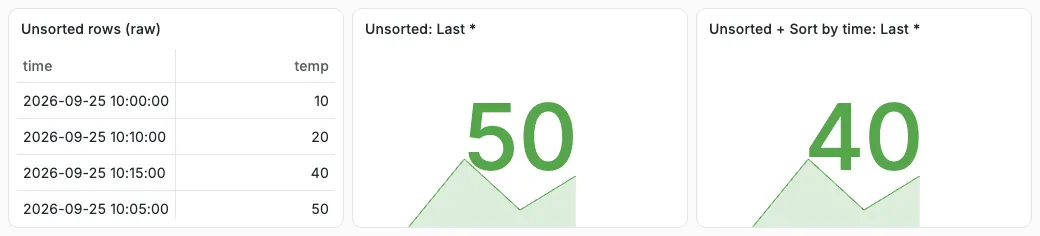
Last * returned 50, the value of the last row, even though 10:15 is the newest timestamp. It doesn’t look at the time at all.
The time series panel makes this worse, because the line itself is drawn in time order:
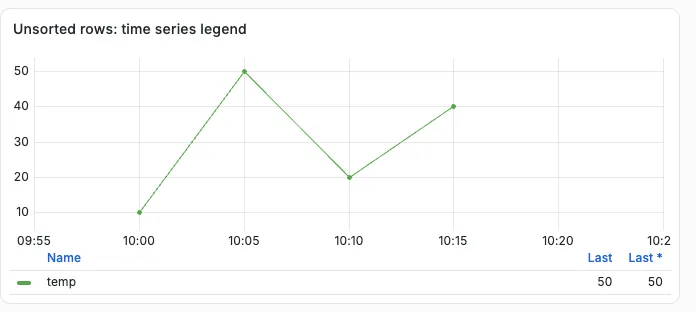
The graph ends at 40, and the legend right below it says 50. That’s exactly what the forum post describes.
Fix, in order of preference:
- Sort in the query. In SQL, add
ORDER BYon the time column. In Flux, the forum poster fixed it with|> sort(columns: ["_time"]). I didn’t test SQL or Flux data sources here, only the effect of the row order. - Or add a Sort by transformation (Transformations → Sort by → Field: your time field, Reverse off). That changed my Stat panel from 50 to 40 (right panel above).
Last value per series in a table
A table panel shows every row. It doesn’t have a Calculation option. To get one row per series with its latest value, add a transformation: Reduce, Mode Series to rows, Calculations Last *.
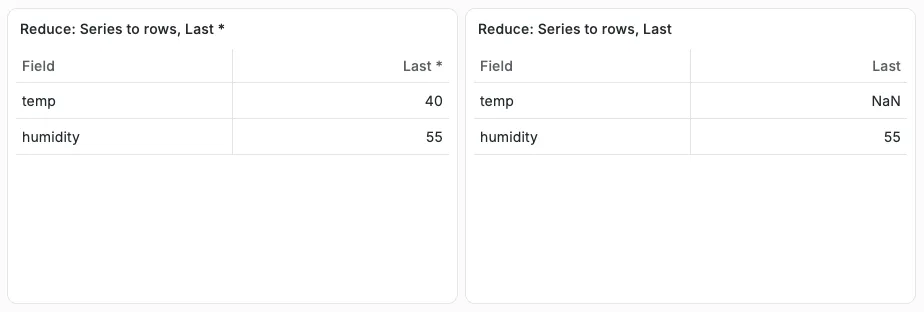
With two queries (temp and humidity), Last * gave temp 40 and humidity 55. With Last, temp came out as NaN because its last row is empty. Humidity’s last row wasn’t, so it looked fine. That kind of half-broken table is easy to miss.
Where the setting is in each panel
| Panel | Where to set “last value” (Grafana 13.2.2) | Default I got |
|---|---|---|
| Stat, Gauge, Bar gauge | Value options → Calculation | Last * |
| Time series legend | Legend → Values (you can pick several) | not tested |
| Table | Transformations → Reduce → Calculations | no reduction, all rows |
What I’d do
- Choose Last *, not Last, for “current value” panels. Last only makes sense if a blank panel is the signal you want.
- After upgrading an old dashboard, check each Stat panel’s Calculation. Migrated singlestat panels without an explicit setting become Mean.
- If the legend disagrees with the graph, check the row order with Table view or the query inspector before changing calculations.
What this test does not cover
- Only Grafana OSS 13.2.2 in Docker, tested 2026-09-25, with the TestData data source (CSV content). I didn’t test Prometheus, InfluxDB or SQL data sources here, so I can’t say which of them return unsorted rows or empty last points by default.
- Stat panels showing several series or several fields, and “All values” mode.
- Grafana Cloud and older self-hosted versions. Older versions may use different defaults.